Power BI Dashboards for Autodesk Forma
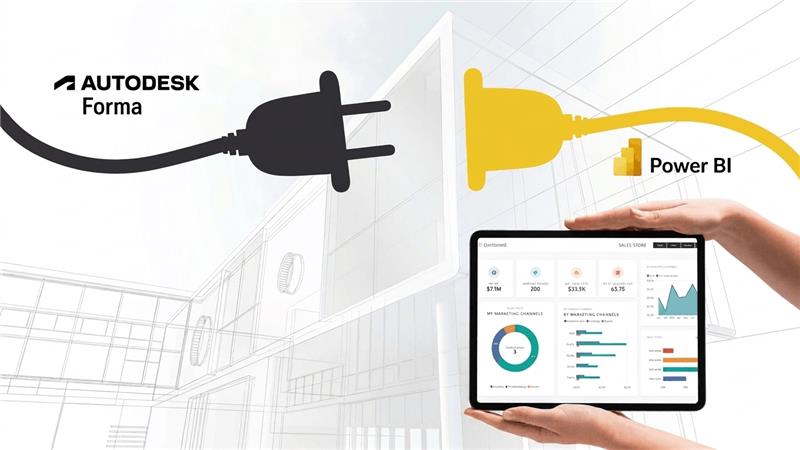
CCTech Power BI dashboards, built on Autodesk Forma (formerly Autodesk Construction Cloud), bridges the gap between project execution and data management. We enable stakeholders to monitor progress, quality, design maturity, asset readiness, cost, and delivery performance from a single unified view.
Autodesk Forma Power BI Dashboards
The construction industry requires real-time visibility, performance tracking, and decision intelligence across the construction lifecycle. The Power BI dashboards suite, built on Forma, translates complex data into clear, role-based insights. These dashboards help the construction industry in avoiding challenges, including fragmented data, delayed or manual reporting, limited transparency, reactive issue management, and document dependency.
- Direct integration with Autodesk Forma data sources
- Real-time synchronization of project information
- Drill down approach from management-level summaries to operational details
- Planned vs Actual project analysis across progress, schedule, and cost
- Clear visibility across different teams including Design, Construction, QA/QC, and Delivery
- Advanced visualization including 3D, 4D (schedule), and 5D (cost)
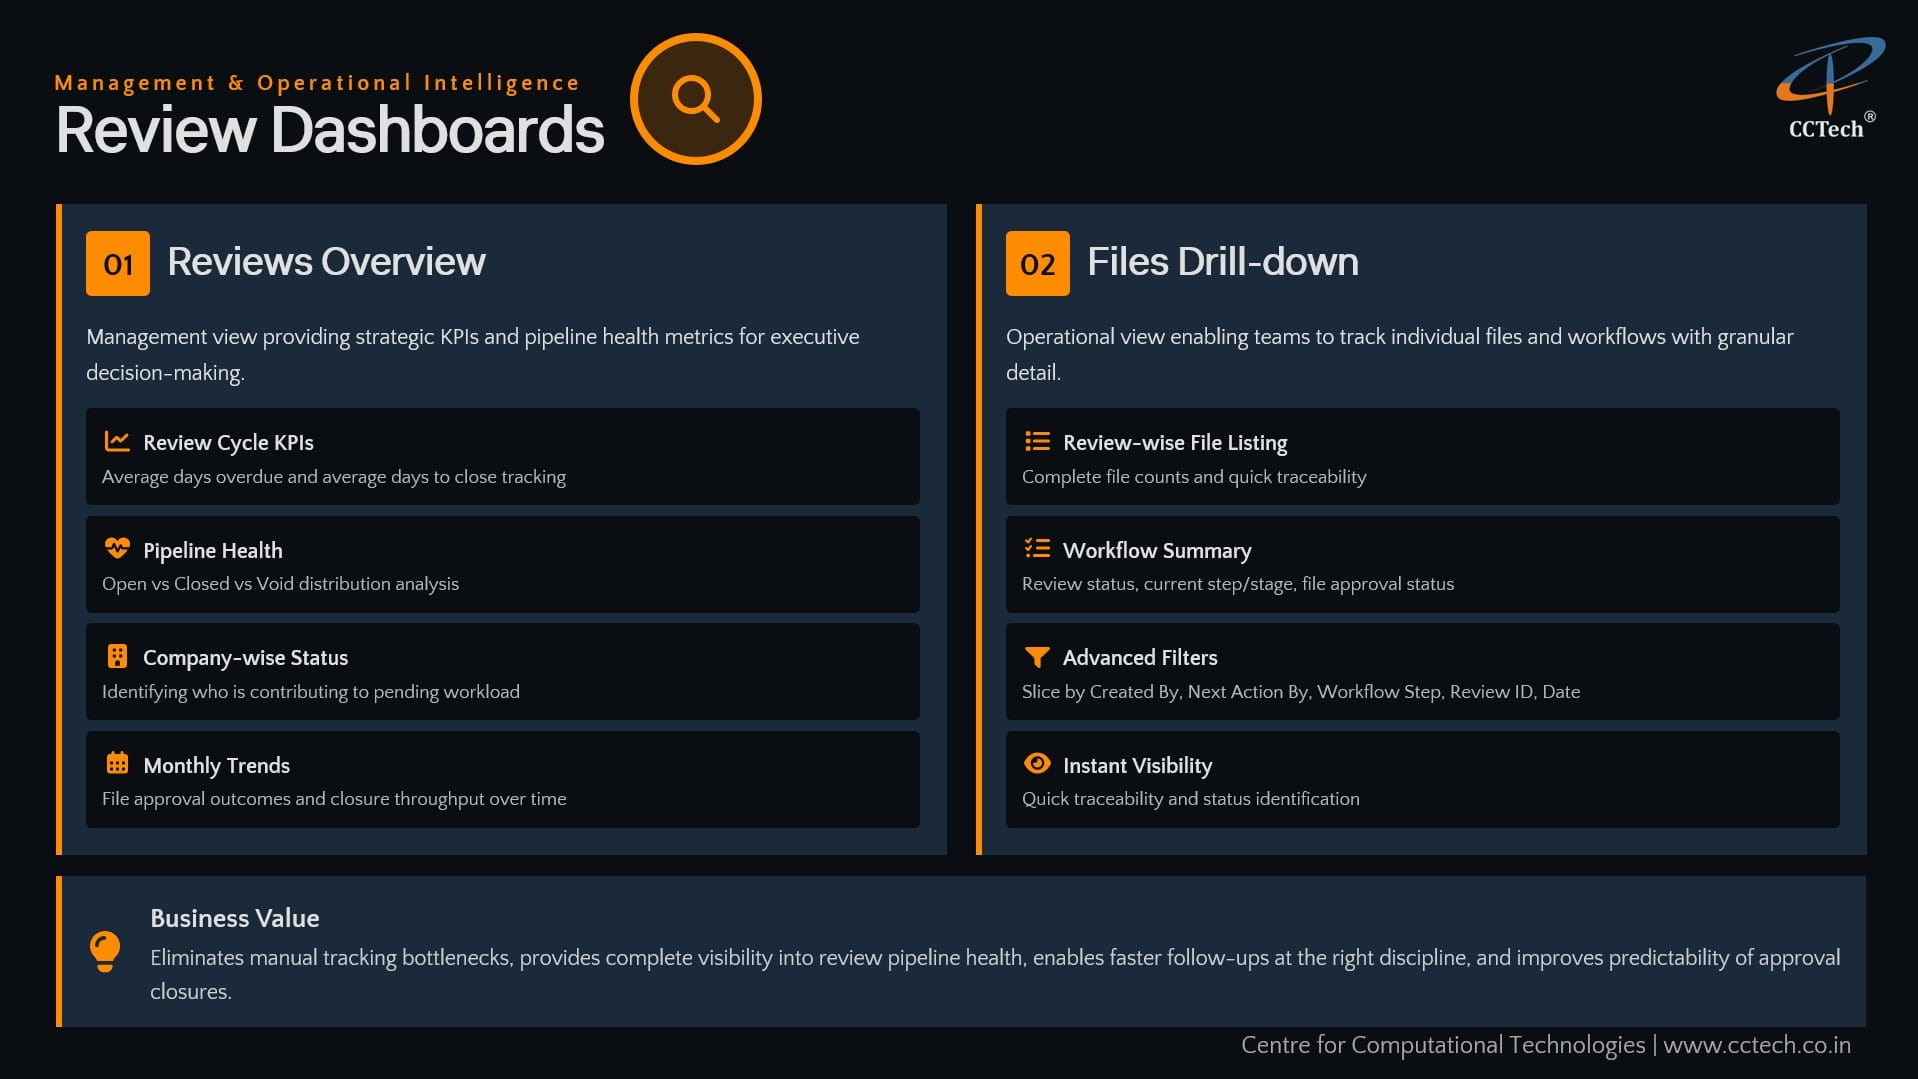
Reviews Overview Dashboard
This centralized Power BI dashboard provides complete visibility of reviews. Project leaders and design managers can monitor the status of the review process, identify bottlenecks, and ensure timely approvals.
- Total reviews categorized by status
- Review Distribution based on discipline and package
- Ageing analysis and Average review cycle time
- Identification of delayed reviews
- Workload and performance visibility of each reviewer
- Trend analysis of review volumes
Files Drill-Down Dashboard
Teams can investigate delays and issues at the granular level with this operational-level Power BI dashboard. It shows file-specific review insights.
- Approval history and review status of each file.
- Identifying files based on number of comments, responses, and unresolved issues.
- Review Distribution based on discipline and package
- Identification of frequently revised files
- Faster root-cause analysis for rejected submissions
- Improved coordination between design consultants and reviewers
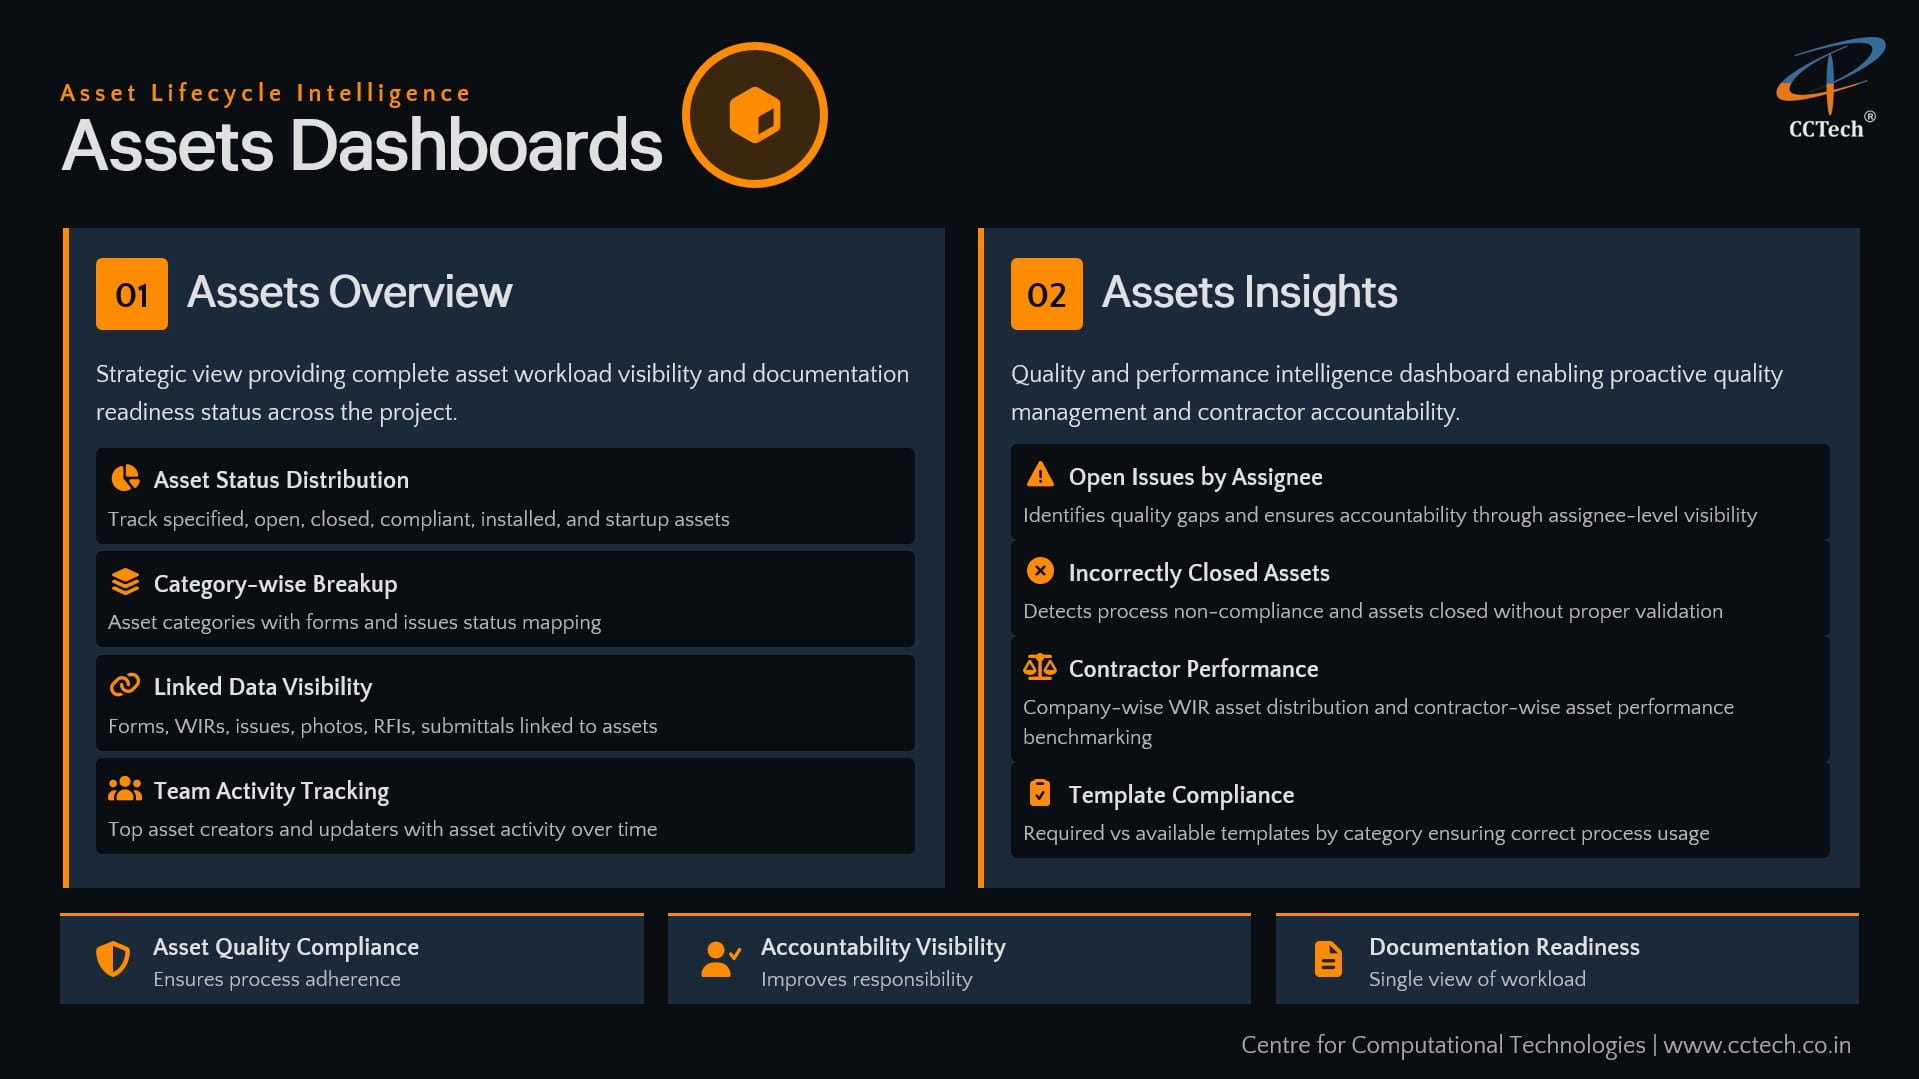
Assets Overview Dashboard
Available assets, installed, and commissioned are visible on a high-level dashboard providing visibility into project assets tracked within Forma.
- Total assets grouped by category, system, and location
- Asset status tracking (Planned, Installed, Commissioned, Pending)
- Asset Distribution by site and building
- Contractor- and vendor-level asset tracking
- Identification of missing, delayed, or incomplete assets
- Readiness tracking for handover and operations
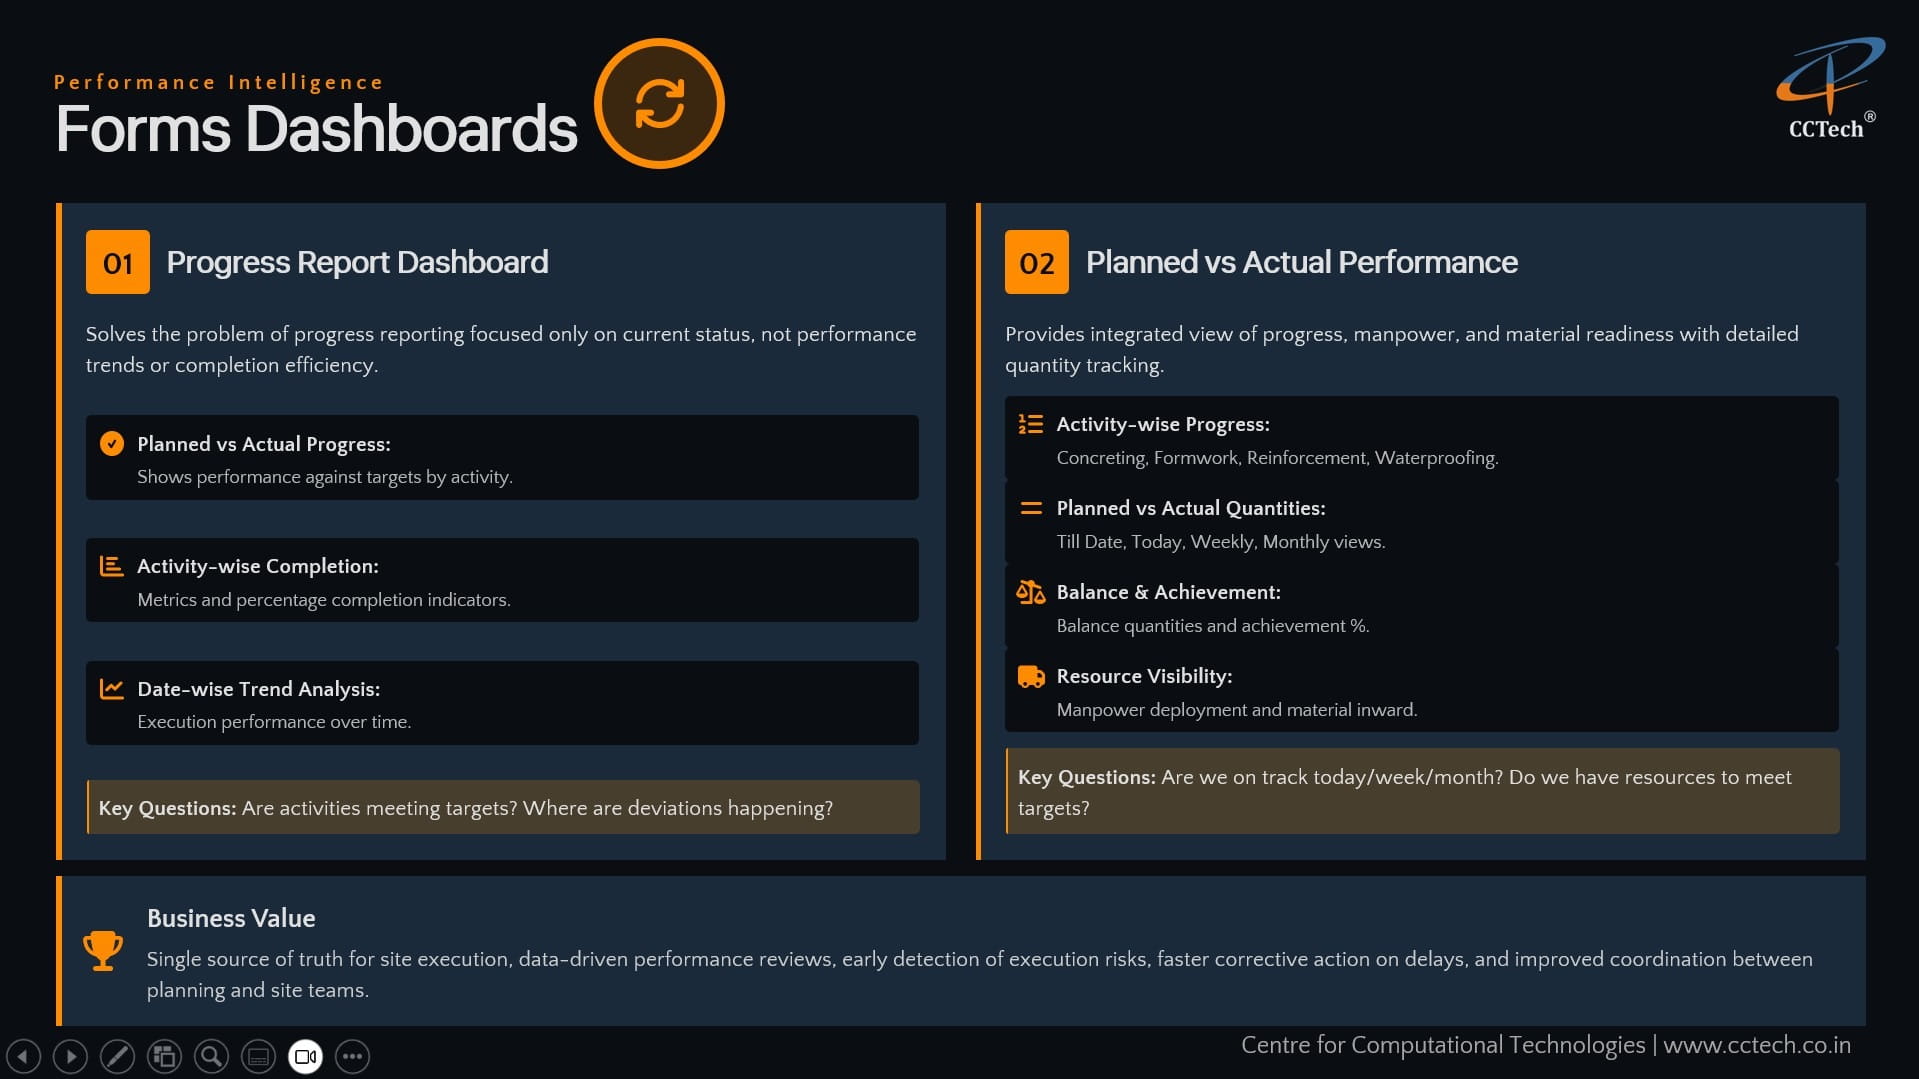
Forms Dashboards
It contains two types of dashboards:
1. Progress Report Dashboard
The construction progress report is fetched from Forma Forms and highlighted on the progress report dashboard, enabling transparency and audit tracking.
2. Planned vs Actual Performance Dashboard
It is a performance management dashboard designed to compare planned targets against actual execution using structured site data.
- Time-based trend analysis across projects and packages
- Planned vs actual progress with variance analysis
- Contractor- and location-wise performance visibility
- Early identification of delays and underperforming resources
- Compliance, submission completeness, and reporting reliability
- Performance scorecards and corrective insights
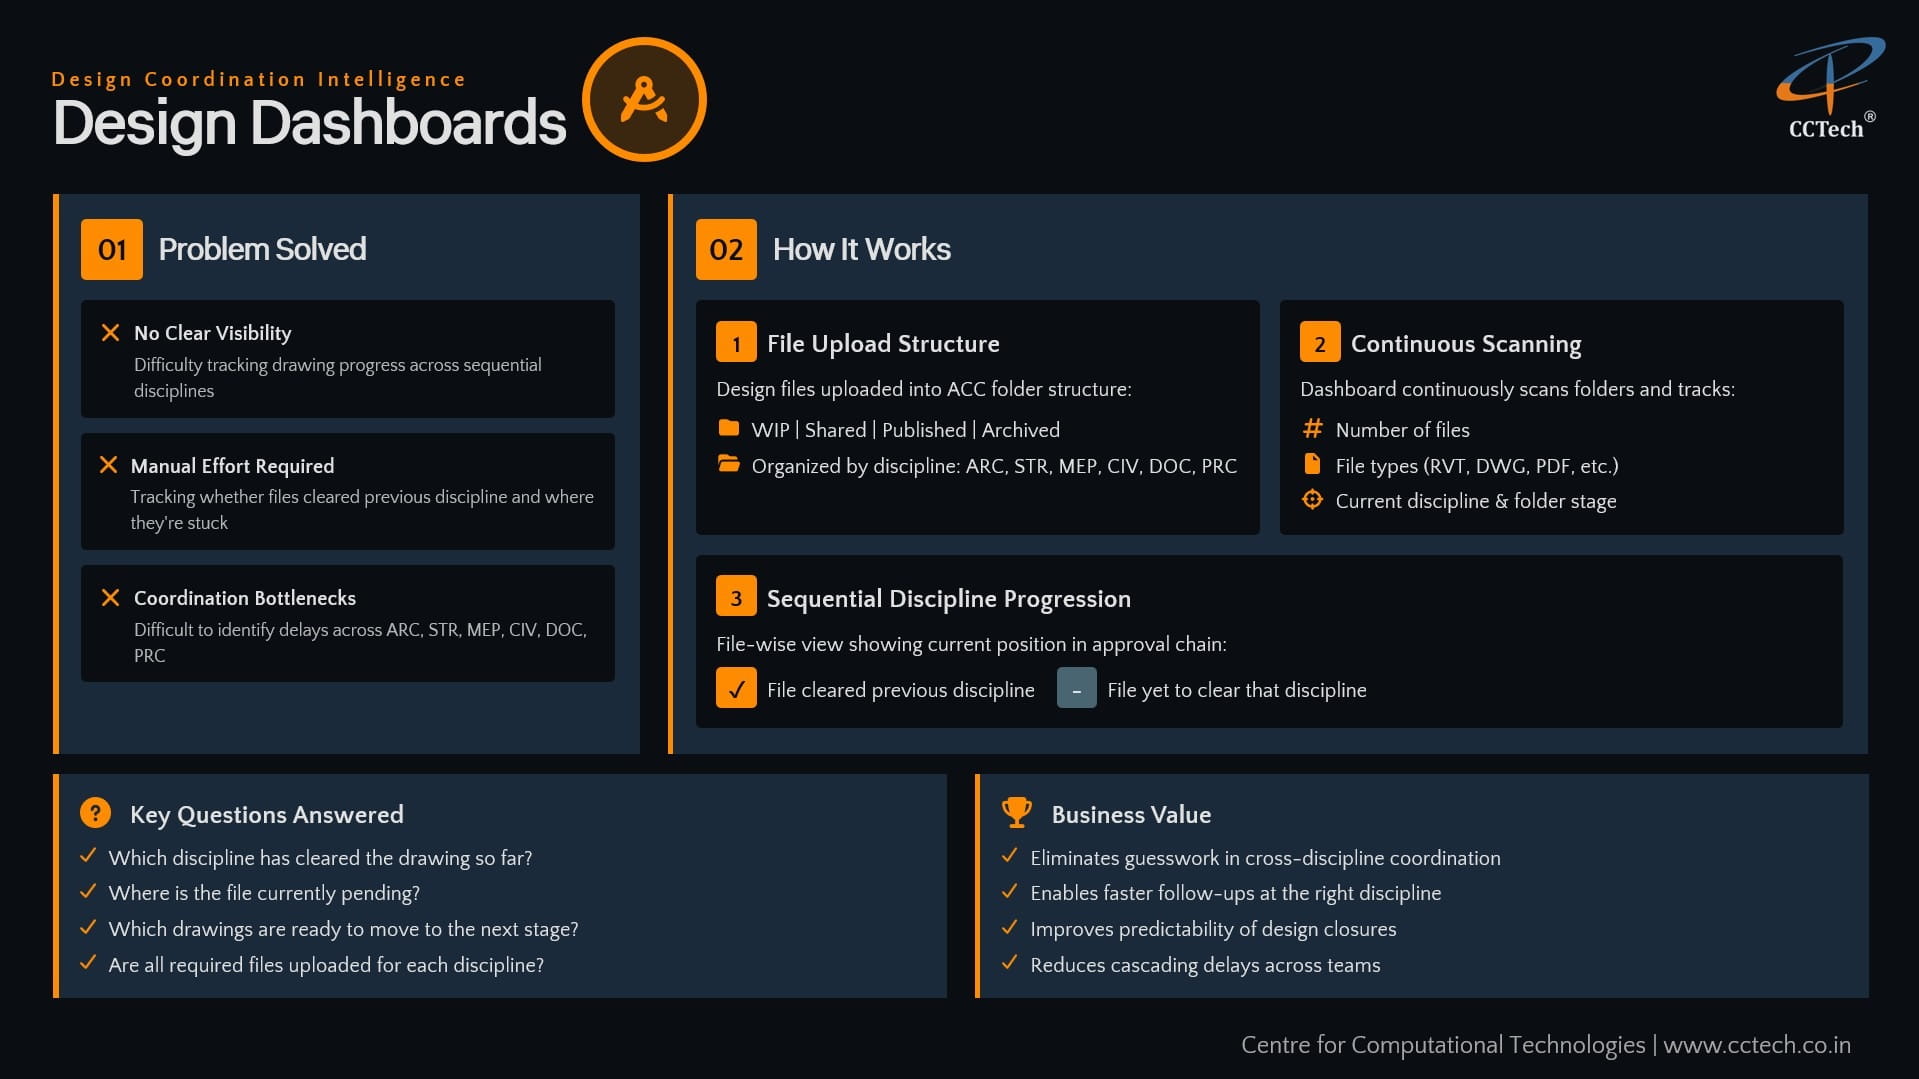
Design Coordination Dashboard
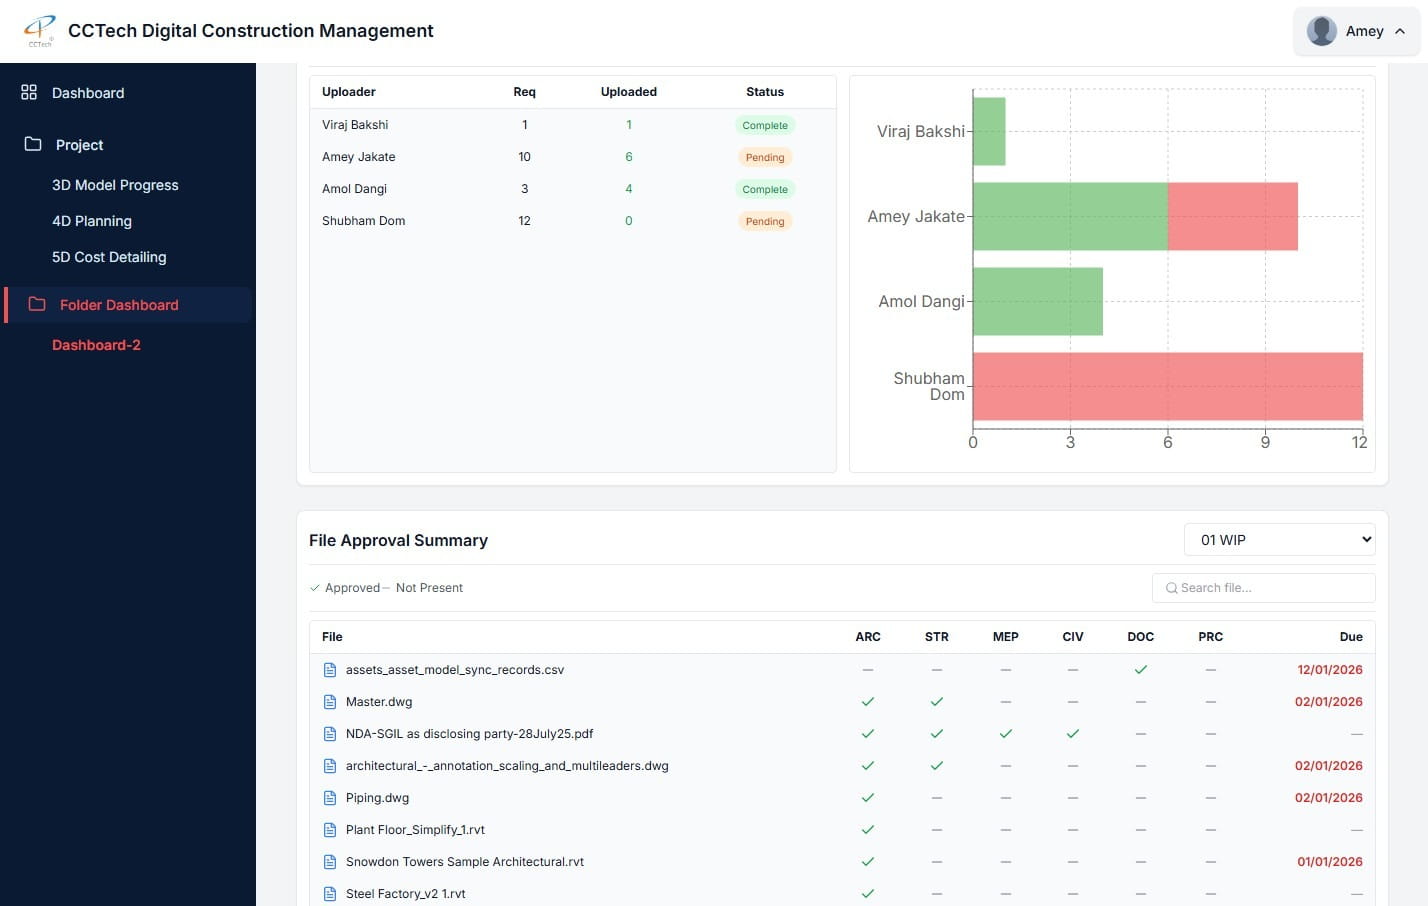
Design maturity and coordination are highlighted on this dashboard. It leverages Forma folder structures and file workflows.
- File tracking across WIP, Shared, Published, and Archived stages
- Design progress tracking as per disciplines
- Identification of dependencies and bottlenecks
- Design freeze readiness assessment
- Visibility into incomplete design packages
- Enhanced control over design deliverables and timelines
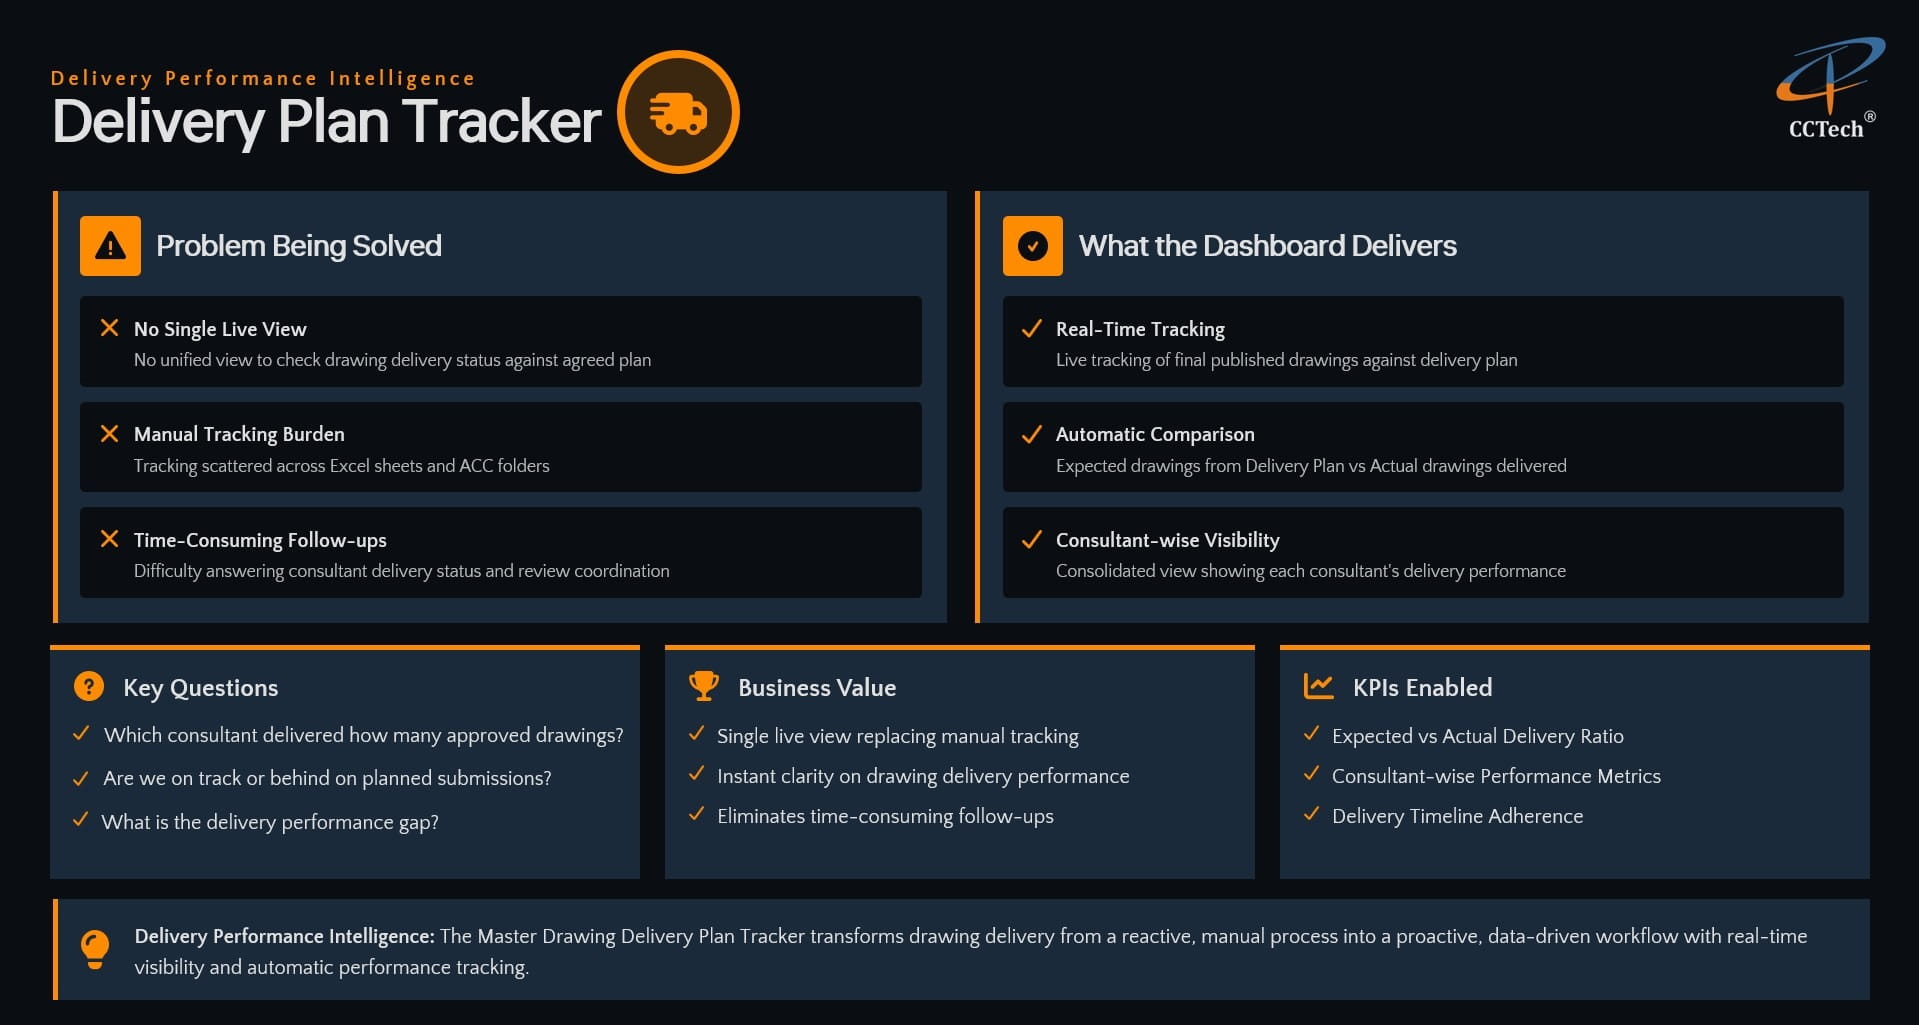
Delivery Planning & Monitoring Dashboard
This dashboard tracks the planned deliverables against actual execution to ensure timely commitments.
- Delivery dates for design and construction packages
- Delivery performance based on consultant and package
- Trend report of delays and identify root-cause
- Impact assessment on construction activities
- Displays schedule control and forecasting