
Friday, March 27, 2026
Optimize Construction Project’s Schedule and Cost with 4D and 5D Visualization
By
Viraj Bakshi
Optimize Construction Project with 4D & 5D Visualization
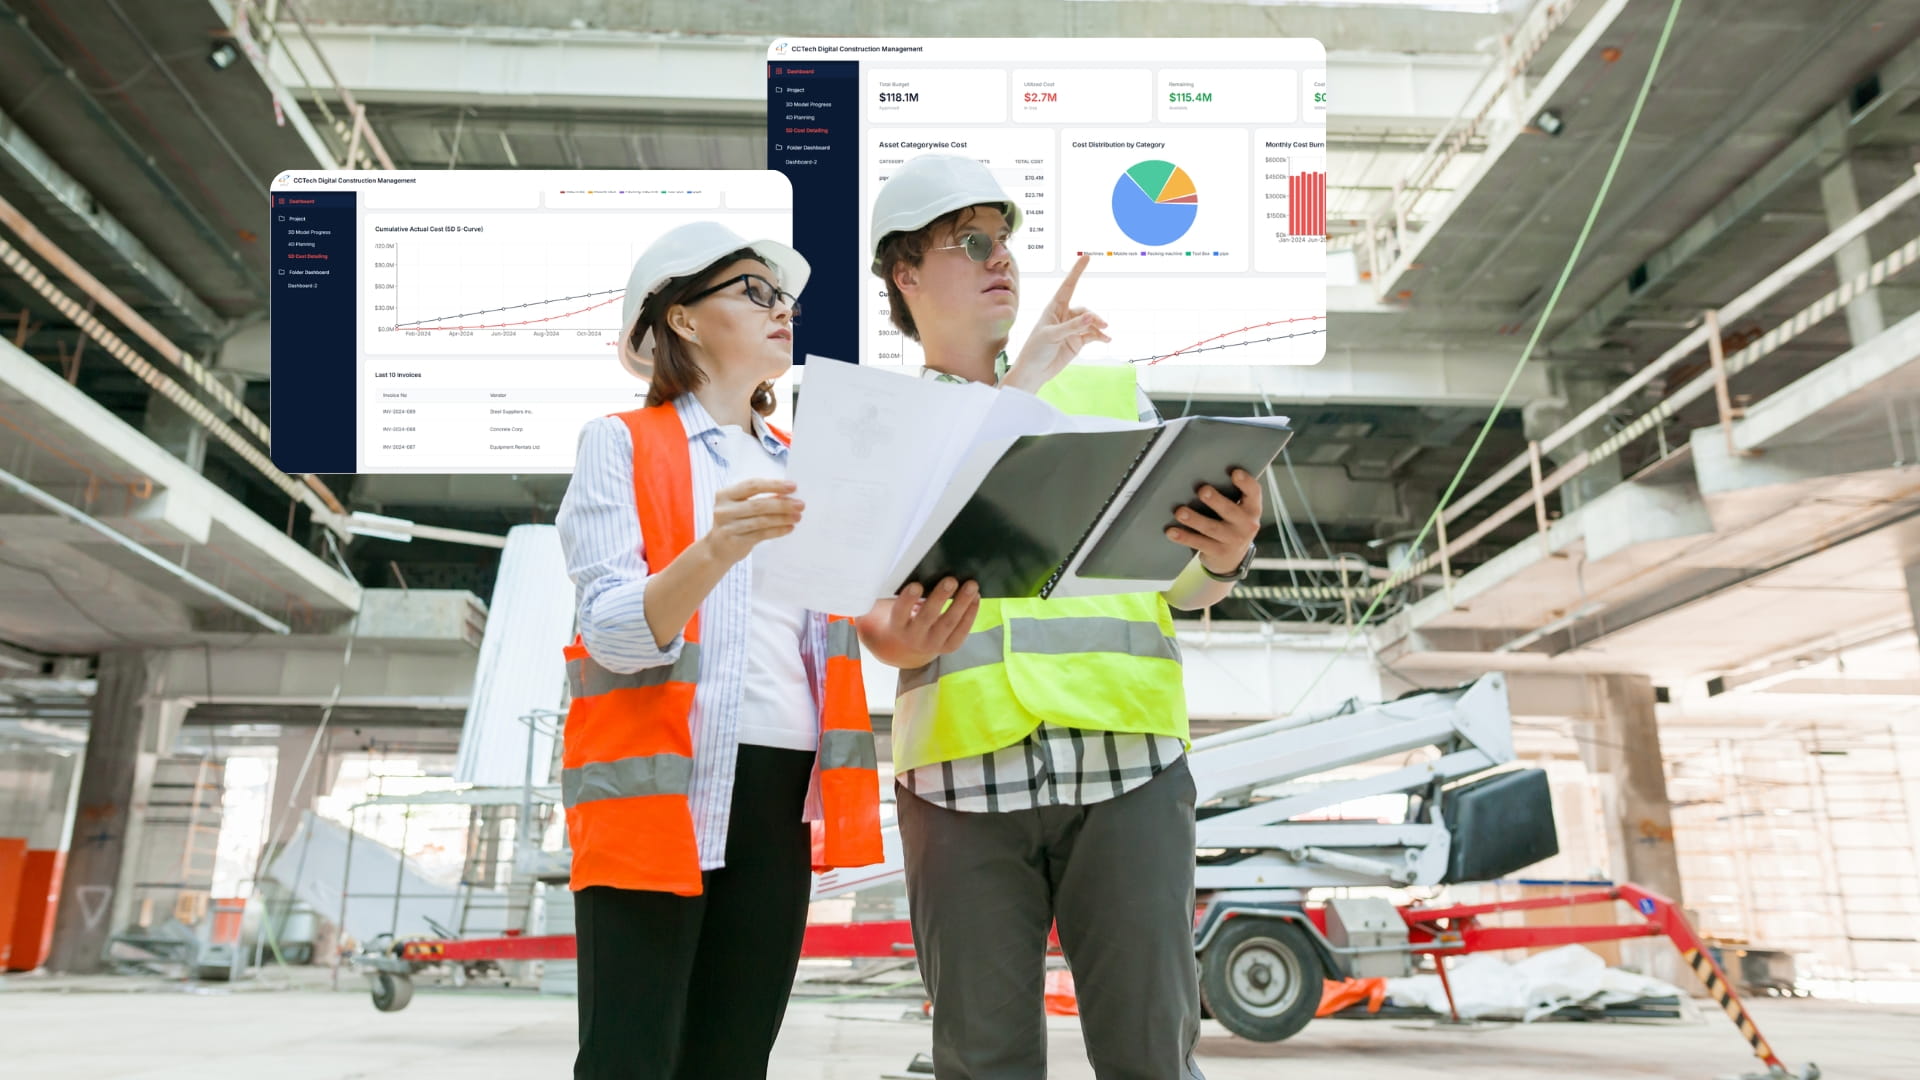
Many global construction projects tend to exceed their original timeline and budget. Traditionally, teams relied on spreadsheets, siloed tools, and static reports to track project status. The document shows that the projects are on track. The schedule shows steady progress with controlled budgets, and reports indicate the project is proceeding as anticipated. However, the onsite survey reveals surface delays, a missed dependency, an unnoticed cost spike, a missed timeline, and budgets stretched beyond limits. Additionally, the issues were discovered after they had escalated.
Studies have shown that 85% of construction projects exceed their budgets, while large projects typically take 20% longer than planned. Often, initial cost estimates fall short by 20–30%, and nearly 98% of projects experience delays or cost overruns. Source: WifiTalents – Project Cost Overrun Statistics Report (2026)
Industry Evolution: Connected Data Ecosystem
The industry is now moving towards a more intelligent approach. The static project schedule needs to be shifted into a dynamic, trackable workflow. Time, as the 4th dimension, enables better project planning and tracking of timelines. Similarly, achieving financial transparency across the project lifecycle brings cost as the 5th dimension. 4D schedule visualization and 5D cost visualization empower smarter, data-driven decision-making in construction.
Platforms like Autodesk Forma (formerly Autodesk Construction Cloud) are closing the gap between planning and execution. Projects are now powered by connected data ecosystems, where design, schedule, and cost data converge into a unified workflow. This evolution marks a smooth project tracking transition.
What happened → What is happening → What will happen next
Unify Data with Autodesk Forma
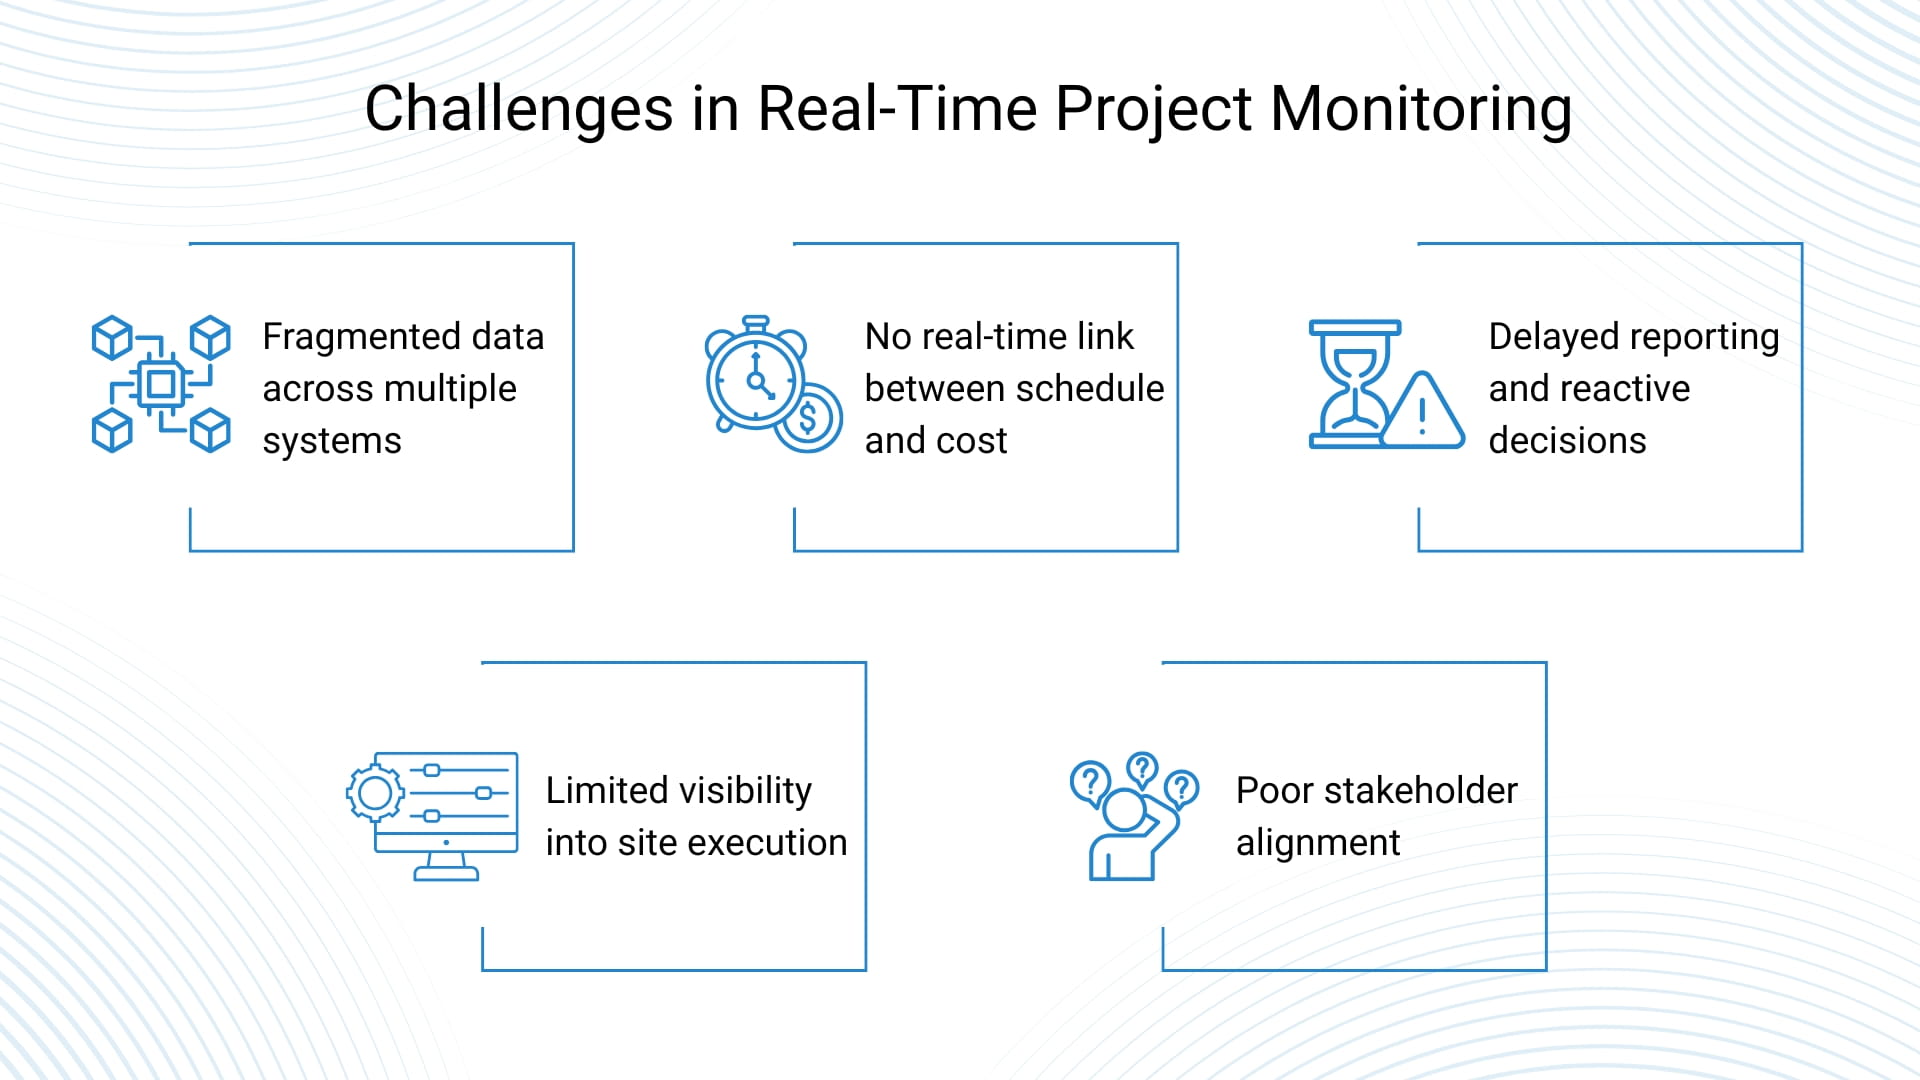
Project alignment has been a common challenge experienced by stakeholders and project team members due to data fragmentation across multiple systems. This problem is solved by integrating Autodesk Forma, a centralized data environment. It connects and synchronizes all the related project information into a single environment.
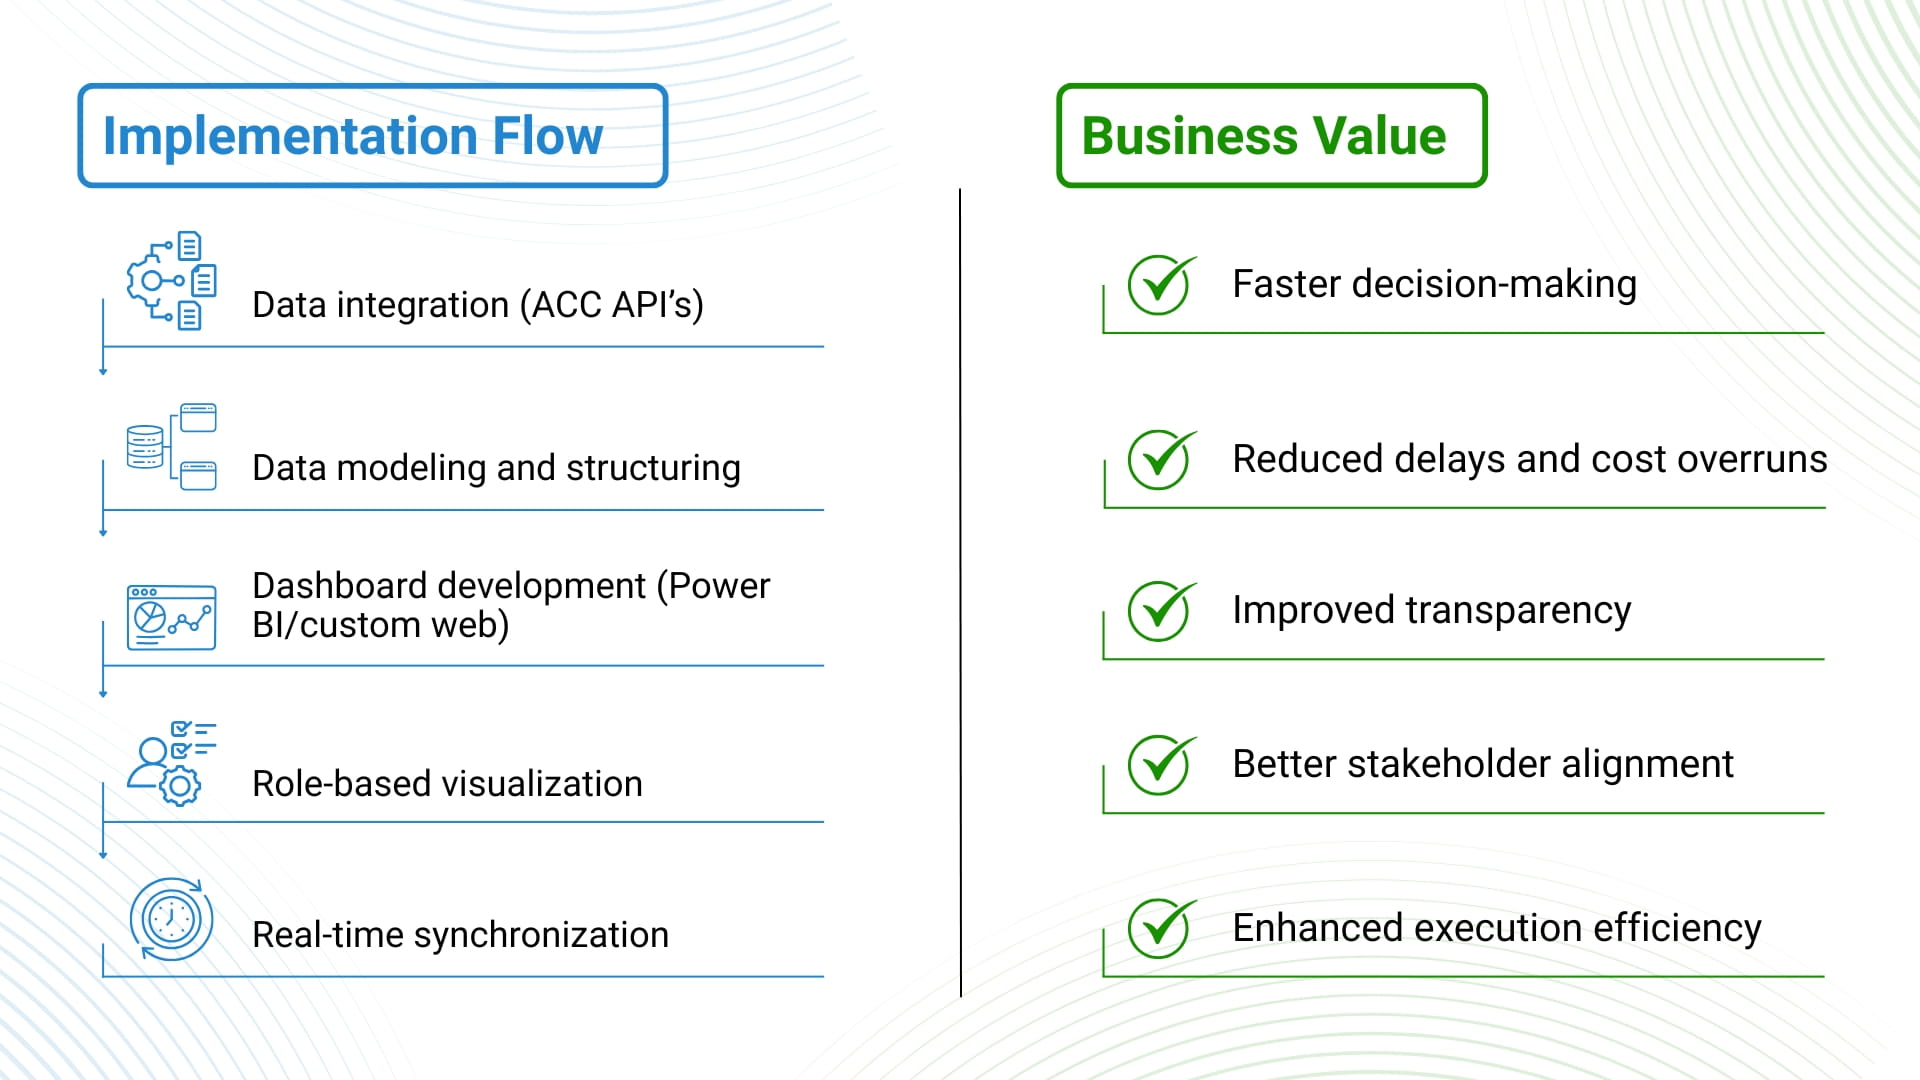
In 4D visualization, data can be imported through Forma-based API’s, platform data, or native import. It integrates schedule data, design, and asset information. It helps teams understand the progress of activities, linked dependencies, and the impact of delays through a time-based dashboard of project execution.
Autodesk Forma connects project budgets, material costs, and financial transactions in the 5D visualization. This enables teams to continuously monitor budget utilization, cost trends, and financial performance.
In general, the two dashboards provide real-time coordination of project data, show project knowledge at a granular level, and enable cross-functional awareness of the design, construction, and finance teams.
Strategic Advantages of 4D Schedule Visualization
4D visualization introduces project schedules into interactive, living systems. It provides a consolidated view of progress, timelines, and processes to the stakeholders. They don’t need to hustle among multiple charts or spreadsheets anymore. The core advantages of schedule visualization are:
- Project timeline and asset-level visibility - It allows teams to visualize the end-to-end project timeline, execution progress, elapsed time, and remaining duration. Visual representation of asset distribution and logistics status helps teams monitor the complete work.
- Execution Control - 4D visualization tracks project activities, impacting project completion. Those activities are automatically flagged to help teams prioritize their efforts. Dashboard components display task hierarchies, task sequencing, milestones, handoffs, and highlight critical path activities.
- Proactive Risk Management – Progress tracking indicates current project trends and risks over time. The 4D schedule visualization dashboard can provide a comparison between planned progress and actual execution, highlighting the deviations. Advanced tracking introduces a combination of S-curves with automatic detection of overdue tasks. Schedule intelligence provides early warnings, indicates execution risks, and analyzes the delay before escalation.
Advantages of bringing Financial Clarity with 5D Cost Visualization
Cost efficiencies in a construction project label the project as a success or failure. With 5D visualization, there is an early visibility of finalized decisions, avoiding downstream issues. The core advantages of cost visualization are-
- Visibility of budget health and asset cost- The dashboards show the expenses and the remaining project cost. Moreover, it also displays asset cost summaries, highlighting the expensive assets and cost overruns.
- Cumulative Cost and Financial Transparency- Project performance directly links vendor invoices and transactions. This enhances the dashboard’s financial transparency and provides a comparison graph of planned and actual costs with S-curves. It highlights consumption trends and deviations.
Explore how CCTech enables 4D and 5D visualization for smarter project delivery:
4D schedule and 5D cost visualization impact project management by converting raw data insights into actionable intelligence. Integration of time and cost into a unified view with Forma enables teams to track, predict, and have proactive control.
About author
Viraj Bakshi
Viraj Bakshi is a Technical Sales Executive at CCTech, where he focuses on delivering complex, solution-oriented offerings for AEC and Manufacturing clients. He works closely with stakeholders to understand technical challenges and recommend tailored software solutions that improve project efficiency, streamline workflows, and enable data-driven decision-making. With a strong foundation from COEP Technological University, Pune, Viraj combines engineering insight with a consultative sales approach to bridge the gap between technology and real-world industry needs.
Comments
Recent posts