On large construction and infrastructure projects, costs rarely spiral because of one critical factor. They drift slowly by delayed visibility, disconnected systems, and a weak link between budgets, assets, and what’s happening on site. 5D cost visualization brings cost, time, and execution together, helping teams see financial reality as it unfolds.
At CCTech, we provide asset-linked, time-based cost visualization so that project managers, finance teams, and EPC organizations can obtain financial clarity in real time. Our 5D solution provides a custom web visualization layer, links budgets, asset costs, spending over time, and execution progress into a single, reliable view. The main financial intelligence features of 5D visualization are highlighted in the sections that follow.
At CCTech, we provide asset-linked, time-based cost visualization so that project managers, finance teams, and EPC organizations can obtain financial clarity in real time. Our 5D solution provides a custom web visualization layer, links budgets, asset costs, spending over time, and execution progress into a single, reliable view. The main financial intelligence features of 5D visualization are highlighted in the sections that follow.
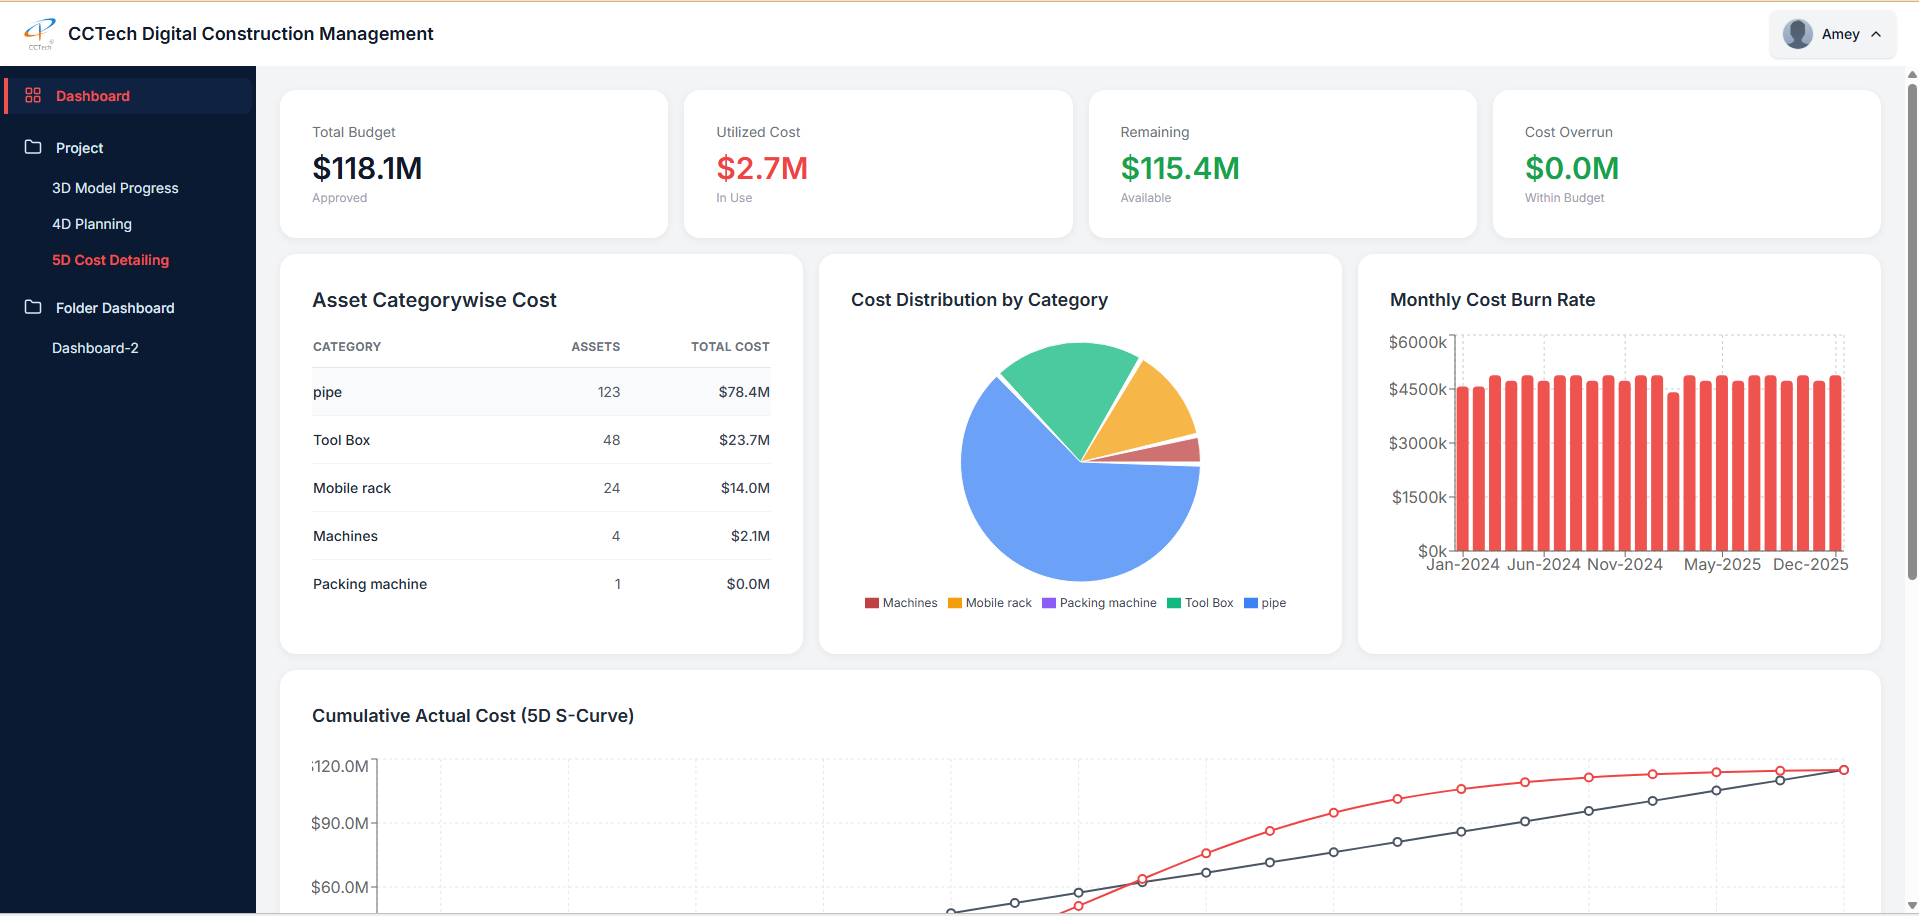
Budget Health and Cost Distribution Across Assets
Understanding Where Project Money Is Going
The 5D visualization dashboard shows an overview of project finances. Teams no longer need to hustle among multiple charts and spreadsheets, and can instantly view how time, scope, and execution are aligned across the project. They can determine the aspects of the project's scope that are accelerating expenses.
Our Offerings
- A single view of financial snapshots showing the overall health of the budget
- Clear view of cost overruns compared to authorized limits
- Visual representation of cost distribution based on asset cost summaries and groups with high spending
- Highlights the link between physical assets and financial impacts.
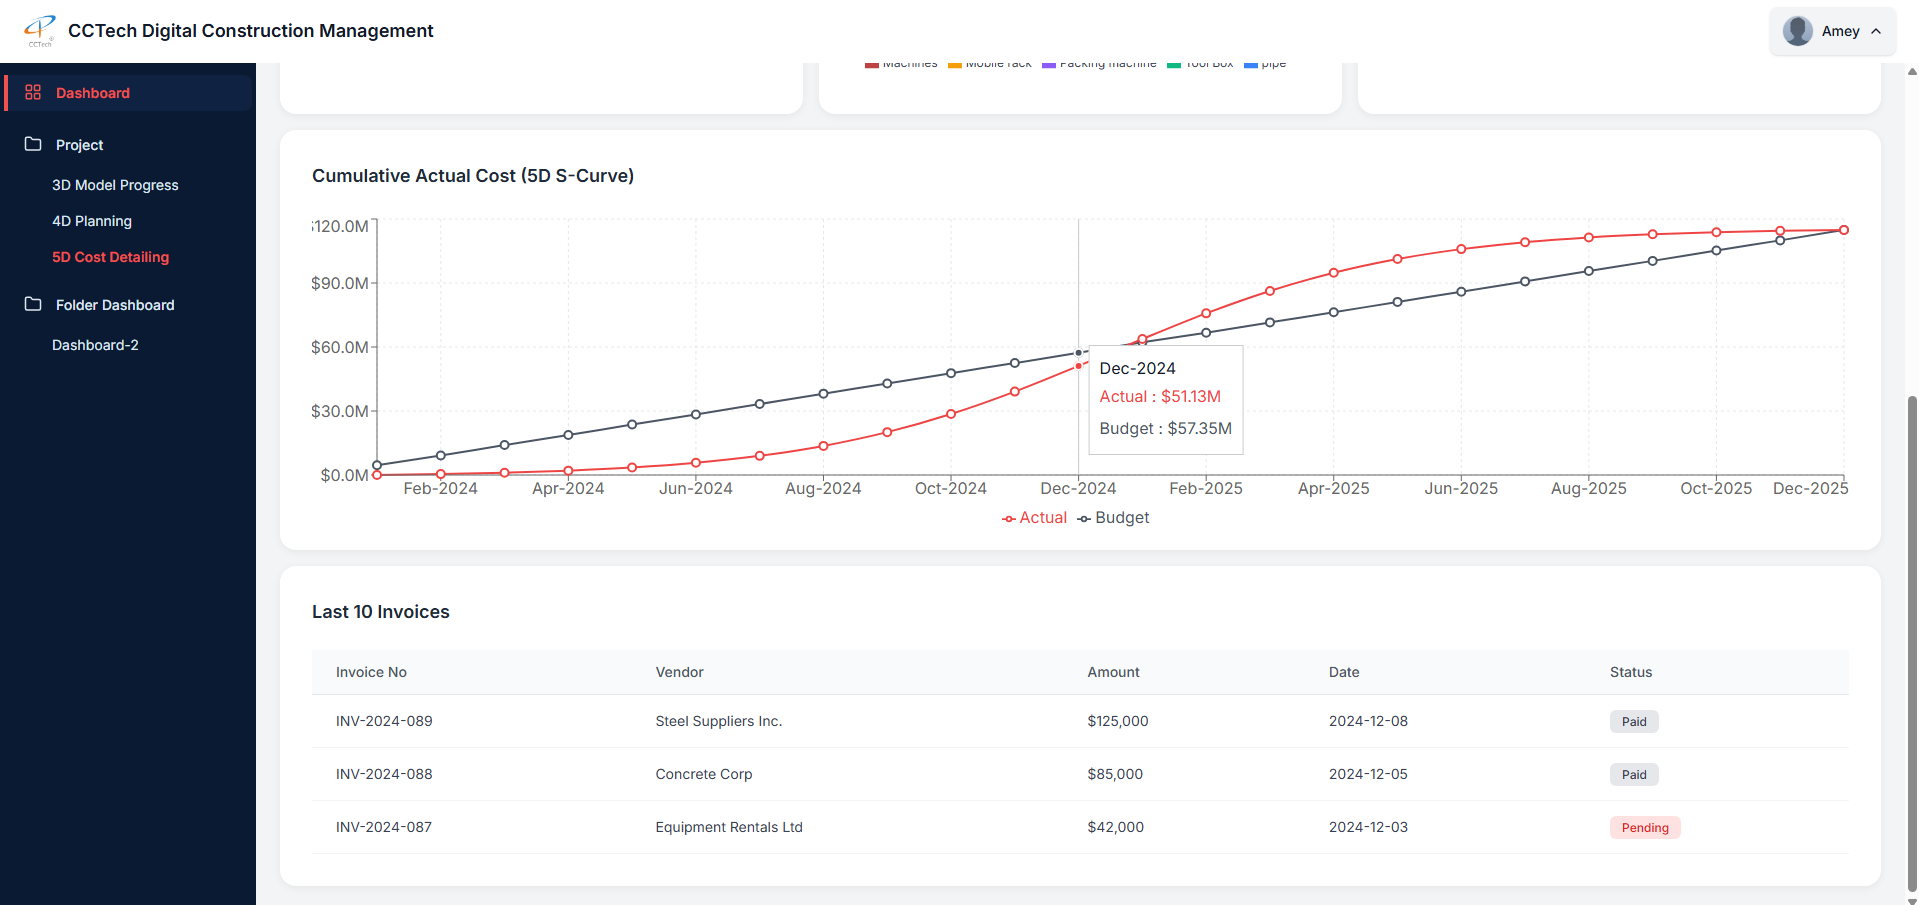
Cumulative Cost Tracking & Financial Transparency
Connecting Transactions to Project-Level Outcomes
Progress tracking just not only focuses on percentages. It implies trends and risks over time. The 5D dashboard displays the graphical comparison of planned progress with actual execution, highlighting the deviations. Early detection of deviations allows teams to make necessary corrections before overruns become unavoidable. Additionally, invoices are made visible to link specific transactions against overall cost performance.
Our Offerings
This guarantees that financial decisions are grounded in both on-site reality and numerical data.
- Visual representation of planned vs actual execution with 5D S-Curves
- Early indication of exceeded consumptions
- Visibility of current vendor invoices, budget trends and the status of payments
- Improved transparency between project, procurement, and finance teams
This guarantees that financial decisions are grounded in both on-site reality and numerical data.